Credit Card Approval Prediction#
by FRIDHA MEGANTARA PUTRA#
import pandas as pd
import matplotlib.pyplot as plt
import pandas as pd
from datetime import datetime, timedelta
penejelasan dataset#
Kartu skor kredit adalah metode pengendalian risiko yang umum digunakan dalam industri keuangan. Metode ini menggunakan informasi pribadi dan data yang diajukan oleh pemohon kartu kredit untuk memprediksi kemungkinan gagal bayar di masa depan dan pinjaman kartu kredit. Bank dapat memutuskan apakah akan menerbitkan kartu kredit kepada pemohon. Skor kredit dapat mengkuantifikasi besarnya risiko secara objektif.
Feature name |
Explanation |
Remarks |
|---|---|---|
ID |
Client number |
|
CODE_GENDER |
Gender |
|
FLAG_OWN_CAR |
Is there a car |
|
FLAG_OWN_REALTY |
Is there a property |
|
CNT_CHILDREN |
Number of children |
|
AMT_INCOME_TOTAL |
Annual income |
|
NAME_INCOME_TYPE |
Income category |
|
NAME_EDUCATION_TYPE |
Education level |
|
NAME_FAMILY_STATUS |
Marital status |
|
NAME_HOUSING_TYPE |
Way of living |
|
DAYS_BIRTH |
Birthday |
Count backwards from current day (0), -1 means yesterday |
DAYS_EMPLOYED |
Start date of employment |
Count backwards from current day (0). If positive, it means the person is currently unemployed. |
FLAG_MOBIL |
Is there a mobile phone |
|
FLAG_WORK_PHONE |
Is there a work phone |
|
FLAG_PHONE |
Is there a phone |
|
FLAG_EMAIL |
Is there an email |
|
OCCUPATION_TYPE |
Occupation |
|
CNT_FAM_MEMBERS |
Family size |
Feature name |
Explanation |
Remarks |
|---|---|---|
ID |
Client number |
|
MONTHS_BALANCE |
Record month |
The month of the extracted data is the starting point, backwards, 0 is the current month, -1 is the previous month, and so on |
STATUS |
Status |
0: 1-29 days past due |
IMPORT DATASET#
# df1 = pd.read_csv('/kaggle/input/credit-card-approval-prediction/application_record.csv')
# print (df1['CODE_GENDER'].unique())
# print (df1['FLAG_OWN_CAR'].unique())
# print (df1['FLAG_OWN_REALTY'].unique())
# print (df1['CNT_CHILDREN'].unique())
# print (df1['NAME_INCOME_TYPE'].unique())
# print (df1['NAME_EDUCATION_TYPE'].unique())
# print (df1['NAME_FAMILY_STATUS'].unique())
# print (df1['NAME_HOUSING_TYPE'].unique())
# print (df1['OCCUPATION_TYPE'].unique())
# print (df['CNT_FAM_MEMBERS'].unique())
df1.dtypes
---------------------------------------------------------------------------
NameError                                 Traceback (most recent call last)
Cell In[4], line 1
----> 1 df1.dtypes

NameError: name 'df1' is not defined
df1.head()
| ID | CODE_GENDER | FLAG_OWN_CAR | FLAG_OWN_REALTY | CNT_CHILDREN | AMT_INCOME_TOTAL | NAME_INCOME_TYPE | NAME_EDUCATION_TYPE | NAME_FAMILY_STATUS | NAME_HOUSING_TYPE | DAYS_BIRTH | DAYS_EMPLOYED | FLAG_MOBIL | FLAG_WORK_PHONE | FLAG_PHONE | FLAG_EMAIL | OCCUPATION_TYPE | CNT_FAM_MEMBERS | |
|---|---|---|---|---|---|---|---|---|---|---|---|---|---|---|---|---|---|---|
| 0 | 5008804 | M | Y | Y | 0 | 427500.0 | Working | Higher education | Civil marriage | Rented apartment | -12005 | -4542 | 1 | 1 | 0 | 0 | NaN | 2.0 |
| 1 | 5008805 | M | Y | Y | 0 | 427500.0 | Working | Higher education | Civil marriage | Rented apartment | -12005 | -4542 | 1 | 1 | 0 | 0 | NaN | 2.0 |
| 2 | 5008806 | M | Y | Y | 0 | 112500.0 | Working | Secondary / secondary special | Married | House / apartment | -21474 | -1134 | 1 | 0 | 0 | 0 | Security staff | 2.0 |
| 3 | 5008808 | F | N | Y | 0 | 270000.0 | Commercial associate | Secondary / secondary special | Single / not married | House / apartment | -19110 | -3051 | 1 | 0 | 1 | 1 | Sales staff | 1.0 |
| 4 | 5008809 | F | N | Y | 0 | 270000.0 | Commercial associate | Secondary / secondary special | Single / not married | House / apartment | -19110 | -3051 | 1 | 0 | 1 | 1 | Sales staff | 1.0 |
Pra Pemrosesan#
encode data kategorikal menjadi binary dan ubah tanggal menjadi tanggal asli dari sekarag#
kolom yang memiliki nilai kategorikal akan di encode menjadi binary dan mengubah tanggal menjadi tanggal asli
import pandas as pd

# Definisikan kolom-kolom yang perlu diubah
columns_to_encode = [
    'CODE_GENDER',
    'FLAG_OWN_CAR',
    'FLAG_OWN_REALTY',
    'NAME_INCOME_TYPE',
    'NAME_EDUCATION_TYPE',
    'NAME_FAMILY_STATUS',
    'NAME_HOUSING_TYPE',
    'OCCUPATION_TYPE'
]

# Lakukan one-hot encoding untuk setiap kolom
for column in columns_to_encode:
    df1 = pd.get_dummies(df1, columns=[column], prefix=column.replace('_', ' '))

# Ubah nilai False menjadi 0 dan True menjadi 1
for column in df1.columns:
    if df1[column].dtype == bool:
        df1[column] = df1[column].astype(int)

# columns_to_encode = [
#     'CODE_GENDER',
#     'FLAG_OWN_CAR',
#     'FLAG_OWN_REALTY',
#     'NAME_INCOME_TYPE',
#     'NAME_EDUCATION_TYPE',
#     'NAME_FAMILY_STATUS',
#     'NAME_HOUSING_TYPE',
#     'OCCUPATION_TYPE'
# ]

# for column in columns_to_encode:
#     df1 = pd.get_dummies(df1, columns=[column], prefix=column.replace('_', ' '))
# ------------------------------------------------------------------------------------------------

# Tanggal hari ini
today = datetime.today()

def days_birth_to_date(days_birth):
    birth_date = datetime.today() + timedelta(days=days_birth)
    return birth_date.strftime('%d-%m-%Y')

# Ubah DAYS_BIRTH menjadi usia dalam tahun
df1['AGE'] = abs(df1['DAYS_BIRTH']) / 365
# Bulatkan usia ke bilangan bulat terdekat
df1['AGE'] = round(df1['AGE'])

# Ubah DAYS_BIRTH menjadi usia dalam tahun
df1['EMPLOYED'] = abs(df1['DAYS_EMPLOYED']) / 365
# Bulatkan usia ke bilangan bulat terdekat
df1['DAYS_EMPLOYED'] = round(df1['DAYS_EMPLOYED'])
df1.head()
| ID | CNT_CHILDREN | AMT_INCOME_TOTAL | DAYS_BIRTH | DAYS_EMPLOYED | FLAG_MOBIL | FLAG_WORK_PHONE | FLAG_PHONE | FLAG_EMAIL | CNT_FAM_MEMBERS | ... | OCCUPATION TYPE_Managers | OCCUPATION TYPE_Medicine staff | OCCUPATION TYPE_Private service staff | OCCUPATION TYPE_Realty agents | OCCUPATION TYPE_Sales staff | OCCUPATION TYPE_Secretaries | OCCUPATION TYPE_Security staff | OCCUPATION TYPE_Waiters/barmen staff | AGE | EMPLOYED | |
|---|---|---|---|---|---|---|---|---|---|---|---|---|---|---|---|---|---|---|---|---|---|
| 0 | 5008804 | 0 | 427500.0 | -12005 | -4542 | 1 | 1 | 0 | 0 | 2.0 | ... | 0 | 0 | 0 | 0 | 0 | 0 | 0 | 0 | 33.0 | 12.443836 |
| 1 | 5008805 | 0 | 427500.0 | -12005 | -4542 | 1 | 1 | 0 | 0 | 2.0 | ... | 0 | 0 | 0 | 0 | 0 | 0 | 0 | 0 | 33.0 | 12.443836 |
| 2 | 5008806 | 0 | 112500.0 | -21474 | -1134 | 1 | 0 | 0 | 0 | 2.0 | ... | 0 | 0 | 0 | 0 | 0 | 0 | 1 | 0 | 59.0 | 3.106849 |
| 3 | 5008808 | 0 | 270000.0 | -19110 | -3051 | 1 | 0 | 1 | 1 | 1.0 | ... | 0 | 0 | 0 | 0 | 1 | 0 | 0 | 0 | 52.0 | 8.358904 |
| 4 | 5008809 | 0 | 270000.0 | -19110 | -3051 | 1 | 0 | 1 | 1 | 1.0 | ... | 0 | 0 | 0 | 0 | 1 | 0 | 0 | 0 | 52.0 | 8.358904 |
5 rows × 57 columns
# df2= pd.read_csv('/kaggle/input/credit-card-approval-prediction/credit_record.csv')
df2.head()
| ID | MONTHS_BALANCE | STATUS | |
|---|---|---|---|
| 0 | 5001711 | 0 | X |
| 1 | 5001711 | -1 | 0 |
| 2 | 5001711 | -2 | 0 |
| 3 | 5001711 | -3 | 0 |
| 4 | 5001712 | 0 | C |
#
Mengubah Nilai pada data 2#
Nilai 6 mewakili ‘X’ dan 7 mewakili ‘C’, dianggap sebagai ekstensi dari 0-5.#
hal ini dilakukan agar tidak ada huruf
# One-hot encoding
df2_encoded = pd.get_dummies(df2, columns=['STATUS'], prefix='STATUS')

# atau Binary encoding
df2['STATUS'] = df2['STATUS'].replace({'X': 6, 'C': 7})
# Nilai di atas 5 mewakili 'X' dan 'C', dianggap sebagai ekstensi dari 0-5.
df2_encoded = df2

print(df2_encoded)
              ID  MONTHS_BALANCE STATUS
0        5001711               0      6
1        5001711              -1      0
2        5001711              -2      0
3        5001711              -3      0
4        5001712               0      7
...          ...             ...    ...
1048570  5150487             -25      7
1048571  5150487             -26      7
1048572  5150487             -27      7
1048573  5150487             -28      7
1048574  5150487             -29      7

[1048575 rows x 3 columns]
melakukan merge#
df1 dan df2 akan di merge#
df1 dan df2 akan di merge dengan inner berdasarkan ID
df = pd.merge(df1, df2, on='ID', how='inner')
df.head()
| ID | CNT_CHILDREN | AMT_INCOME_TOTAL | DAYS_BIRTH | DAYS_EMPLOYED | FLAG_MOBIL | FLAG_WORK_PHONE | FLAG_PHONE | FLAG_EMAIL | CNT_FAM_MEMBERS | ... | OCCUPATION TYPE_Private service staff | OCCUPATION TYPE_Realty agents | OCCUPATION TYPE_Sales staff | OCCUPATION TYPE_Secretaries | OCCUPATION TYPE_Security staff | OCCUPATION TYPE_Waiters/barmen staff | AGE | EMPLOYED | MONTHS_BALANCE | STATUS | |
|---|---|---|---|---|---|---|---|---|---|---|---|---|---|---|---|---|---|---|---|---|---|
| 0 | 5008804 | 0 | 427500.0 | -12005 | -4542 | 1 | 1 | 0 | 0 | 2.0 | ... | 0 | 0 | 0 | 0 | 0 | 0 | 33.0 | 12.443836 | 0 | 7 |
| 1 | 5008804 | 0 | 427500.0 | -12005 | -4542 | 1 | 1 | 0 | 0 | 2.0 | ... | 0 | 0 | 0 | 0 | 0 | 0 | 33.0 | 12.443836 | -1 | 7 |
| 2 | 5008804 | 0 | 427500.0 | -12005 | -4542 | 1 | 1 | 0 | 0 | 2.0 | ... | 0 | 0 | 0 | 0 | 0 | 0 | 33.0 | 12.443836 | -2 | 7 |
| 3 | 5008804 | 0 | 427500.0 | -12005 | -4542 | 1 | 1 | 0 | 0 | 2.0 | ... | 0 | 0 | 0 | 0 | 0 | 0 | 33.0 | 12.443836 | -3 | 7 |
| 4 | 5008804 | 0 | 427500.0 | -12005 | -4542 | 1 | 1 | 0 | 0 | 2.0 | ... | 0 | 0 | 0 | 0 | 0 | 0 | 33.0 | 12.443836 | -4 | 7 |
5 rows × 59 columns
df.tail
<bound method NDFrame.tail of              ID  CNT_CHILDREN  AMT_INCOME_TOTAL  DAYS_BIRTH  DAYS_EMPLOYED  \
0       5008804             0          427500.0      -12005          -4542
1       5008804             0          427500.0      -12005          -4542
2       5008804             0          427500.0      -12005          -4542
3       5008804             0          427500.0      -12005          -4542
4       5008804             0          427500.0      -12005          -4542
...         ...           ...               ...         ...            ...
777710  5150337             0          112500.0       -9188          -1193
777711  5150337             0          112500.0       -9188          -1193
777712  5150337             0          112500.0       -9188          -1193
777713  5150337             0          112500.0       -9188          -1193
777714  5150337             0          112500.0       -9188          -1193

        FLAG_MOBIL  FLAG_WORK_PHONE  FLAG_PHONE  FLAG_EMAIL  CNT_FAM_MEMBERS  \
0                1                1           0           0              2.0
1                1                1           0           0              2.0
2                1                1           0           0              2.0
3                1                1           0           0              2.0
4                1                1           0           0              2.0
...            ...              ...         ...         ...              ...
777710           1                0           0           0              1.0
777711           1                0           0           0              1.0
777712           1                0           0           0              1.0
777713           1                0           0           0              1.0
777714           1                0           0           0              1.0

        ...  OCCUPATION TYPE_Private service staff  \
0       ...                                      0
1       ...                                      0
2       ...                                      0
3       ...                                      0
4       ...                                      0
...     ...                                    ...
777710  ...                                      0
777711  ...                                      0
777712  ...                                      0
777713  ...                                      0
777714  ...                                      0

        OCCUPATION TYPE_Realty agents  OCCUPATION TYPE_Sales staff  \
0                                   0                            0
1                                   0                            0
2                                   0                            0
3                                   0                            0
4                                   0                            0
...                               ...                          ...
777710                              0                            0
777711                              0                            0
777712                              0                            0
777713                              0                            0
777714                              0                            0

        OCCUPATION TYPE_Secretaries  OCCUPATION TYPE_Security staff  \
0                                 0                               0
1                                 0                               0
2                                 0                               0
3                                 0                               0
4                                 0                               0
...                             ...                             ...
777710                            0                               0
777711                            0                               0
777712                            0                               0
777713                            0                               0
777714                            0                               0

        OCCUPATION TYPE_Waiters/barmen staff   AGE   EMPLOYED  MONTHS_BALANCE  \
0                                          0  33.0  12.443836               0
1                                          0  33.0  12.443836              -1
2                                          0  33.0  12.443836              -2
3                                          0  33.0  12.443836              -3
4                                          0  33.0  12.443836              -4
...                                      ...   ...        ...             ...
777710                                     0  25.0   3.268493              -9
777711                                     0  25.0   3.268493             -10
777712                                     0  25.0   3.268493             -11
777713                                     0  25.0   3.268493             -12
777714                                     0  25.0   3.268493             -13

        STATUS
0            7
1            7
2            7
3            7
4            7
...        ...
777710       0
777711       2
777712       1
777713       0
777714       0

[777715 rows x 59 columns]>
Drop Kolom#
buang kolom yang tidak digunakan#
kolom ini di buang karena saat one-hot encoding akan membuat kolom baru yang berupa bunary jadi kolom lama sudah tidak di gunakan lagi karna sudah tergantikan
df.drop(columns=['ID', 'AMT_INCOME_TOTAL', 'DAYS_BIRTH', 'DAYS_EMPLOYED'], inplace=True)
df
| CNT_CHILDREN | FLAG_MOBIL | FLAG_WORK_PHONE | FLAG_PHONE | FLAG_EMAIL | CNT_FAM_MEMBERS | CODE GENDER_F | CODE GENDER_M | FLAG OWN CAR_N | FLAG OWN CAR_Y | ... | OCCUPATION TYPE_Private service staff | OCCUPATION TYPE_Realty agents | OCCUPATION TYPE_Sales staff | OCCUPATION TYPE_Secretaries | OCCUPATION TYPE_Security staff | OCCUPATION TYPE_Waiters/barmen staff | AGE | EMPLOYED | MONTHS_BALANCE | STATUS | |
|---|---|---|---|---|---|---|---|---|---|---|---|---|---|---|---|---|---|---|---|---|---|
| 0 | 0 | 1 | 1 | 0 | 0 | 2.0 | 0 | 1 | 0 | 1 | ... | 0 | 0 | 0 | 0 | 0 | 0 | 33.0 | 12.443836 | 0 | 7 |
| 1 | 0 | 1 | 1 | 0 | 0 | 2.0 | 0 | 1 | 0 | 1 | ... | 0 | 0 | 0 | 0 | 0 | 0 | 33.0 | 12.443836 | -1 | 7 |
| 2 | 0 | 1 | 1 | 0 | 0 | 2.0 | 0 | 1 | 0 | 1 | ... | 0 | 0 | 0 | 0 | 0 | 0 | 33.0 | 12.443836 | -2 | 7 |
| 3 | 0 | 1 | 1 | 0 | 0 | 2.0 | 0 | 1 | 0 | 1 | ... | 0 | 0 | 0 | 0 | 0 | 0 | 33.0 | 12.443836 | -3 | 7 |
| 4 | 0 | 1 | 1 | 0 | 0 | 2.0 | 0 | 1 | 0 | 1 | ... | 0 | 0 | 0 | 0 | 0 | 0 | 33.0 | 12.443836 | -4 | 7 |
| ... | ... | ... | ... | ... | ... | ... | ... | ... | ... | ... | ... | ... | ... | ... | ... | ... | ... | ... | ... | ... | ... |
| 777710 | 0 | 1 | 0 | 0 | 0 | 1.0 | 0 | 1 | 1 | 0 | ... | 0 | 0 | 0 | 0 | 0 | 0 | 25.0 | 3.268493 | -9 | 0 |
| 777711 | 0 | 1 | 0 | 0 | 0 | 1.0 | 0 | 1 | 1 | 0 | ... | 0 | 0 | 0 | 0 | 0 | 0 | 25.0 | 3.268493 | -10 | 2 |
| 777712 | 0 | 1 | 0 | 0 | 0 | 1.0 | 0 | 1 | 1 | 0 | ... | 0 | 0 | 0 | 0 | 0 | 0 | 25.0 | 3.268493 | -11 | 1 |
| 777713 | 0 | 1 | 0 | 0 | 0 | 1.0 | 0 | 1 | 1 | 0 | ... | 0 | 0 | 0 | 0 | 0 | 0 | 25.0 | 3.268493 | -12 | 0 |
| 777714 | 0 | 1 | 0 | 0 | 0 | 1.0 | 0 | 1 | 1 | 0 | ... | 0 | 0 | 0 | 0 | 0 | 0 | 25.0 | 3.268493 | -13 | 0 |
777715 rows × 55 columns
nomalisai#
melakukan normalisasi menggunakan MinMax scaler#
normalissasi berguna untuk mengubah nilai menjadi antara 0-1 agar tidak terjadi perbedaan data yang signifikan antar input yang lain
from sklearn.preprocessing import MinMaxScaler

# Inisialisasi MinMaxScaler
scaler = MinMaxScaler()

# Ambil kolom yang ingin dinormalisasi (tidak termasuk kolom "STATUS")
columns_to_normalize = df.columns.difference(['STATUS'])

# Lakukan normalisasi pada kolom yang dipilih
df_normalized = df.copy()  # Membuat salinan DataFrame untuk hasil normalisasi
df_normalized[columns_to_normalize] = scaler.fit_transform(df_normalized[columns_to_normalize])
simpan data normalisasi
df_normalized.to_csv('normal.csv')
df_normalized.dtypes
CNT_CHILDREN                                         float64
FLAG_MOBIL                                           float64
FLAG_WORK_PHONE                                      float64
FLAG_PHONE                                           float64
FLAG_EMAIL                                           float64
CNT_FAM_MEMBERS                                      float64
CODE GENDER_F                                        float64
CODE GENDER_M                                        float64
FLAG OWN CAR_N                                       float64
FLAG OWN CAR_Y                                       float64
FLAG OWN REALTY_N                                    float64
FLAG OWN REALTY_Y                                    float64
NAME INCOME TYPE_Commercial associate                float64
NAME INCOME TYPE_Pensioner                           float64
NAME INCOME TYPE_State servant                       float64
NAME INCOME TYPE_Student                             float64
NAME INCOME TYPE_Working                             float64
NAME EDUCATION TYPE_Academic degree                  float64
NAME EDUCATION TYPE_Higher education                 float64
NAME EDUCATION TYPE_Incomplete higher                float64
NAME EDUCATION TYPE_Lower secondary                  float64
NAME EDUCATION TYPE_Secondary / secondary special    float64
NAME FAMILY STATUS_Civil marriage                    float64
NAME FAMILY STATUS_Married                           float64
NAME FAMILY STATUS_Separated                         float64
NAME FAMILY STATUS_Single / not married              float64
NAME FAMILY STATUS_Widow                             float64
NAME HOUSING TYPE_Co-op apartment                    float64
NAME HOUSING TYPE_House / apartment                  float64
NAME HOUSING TYPE_Municipal apartment                float64
NAME HOUSING TYPE_Office apartment                   float64
NAME HOUSING TYPE_Rented apartment                   float64
NAME HOUSING TYPE_With parents                       float64
OCCUPATION TYPE_Accountants                          float64
OCCUPATION TYPE_Cleaning staff                       float64
OCCUPATION TYPE_Cooking staff                        float64
OCCUPATION TYPE_Core staff                           float64
OCCUPATION TYPE_Drivers                              float64
OCCUPATION TYPE_HR staff                             float64
OCCUPATION TYPE_High skill tech staff                float64
OCCUPATION TYPE_IT staff                             float64
OCCUPATION TYPE_Laborers                             float64
OCCUPATION TYPE_Low-skill Laborers                   float64
OCCUPATION TYPE_Managers                             float64
OCCUPATION TYPE_Medicine staff                       float64
OCCUPATION TYPE_Private service staff                float64
OCCUPATION TYPE_Realty agents                        float64
OCCUPATION TYPE_Sales staff                          float64
OCCUPATION TYPE_Secretaries                          float64
OCCUPATION TYPE_Security staff                       float64
OCCUPATION TYPE_Waiters/barmen staff                 float64
AGE                                                  float64
EMPLOYED                                             float64
MONTHS_BALANCE                                       float64
STATUS                                                object
dtype: object
membagi data menjadi train dan tes#
data akan di bagi menjadi test dan train dengan distribusi data train 80% dan test 20%
# data = pd.read_csv('/kaggle/working/normal.csv')
from sklearn.model_selection import train_test_split

# Pisahkan fitur (X) dan label (Y)
X = data.drop(columns=['STATUS'])  # Ambil semua kolom kecuali 'STATUS'
Y = data['STATUS']  # Ambil kolom 'STATUS' sebagai label

# Bagi data menjadi data pelatihan dan data uji
# Gunakan parameter stratify untuk memastikan pembagian yang seimbang berdasarkan label Y
X_train, X_test, Y_train, Y_test = train_test_split(X, Y, test_size=0.2, random_state=42, stratify=Y)
Modeling#
Memnamgun model dengan Multi Layer Perceptron#
from sklearn.neural_network import MLPClassifier
from sklearn.metrics import accuracy_score
# Inisialisasi model MLP
mlp_model = MLPClassifier(hidden_layer_sizes=(100, 50), max_iter=50, random_state=42)
# Latih model pada data pelatihan
mlp_model.fit(X_train, Y_train)
# Lakukan prediksi pada data uji
Y_pred = mlp_model.predict(X_test)
# Evaluasi performa model
accuracy = accuracy_score(Y_test, Y_pred)
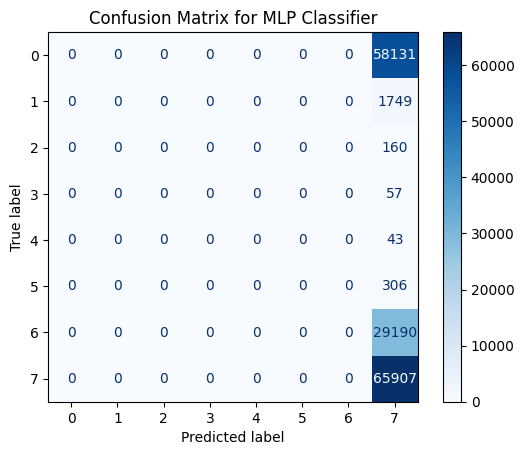
print("Accuracy:", accuracy)
Accuracy: 0.42372205756607495
Membangun model dengan KNN#
from sklearn.neighbors import KNeighborsClassifier
# Inisialisasi model KNN
knn_model = KNeighborsClassifier(n_neighbors=5)
# Latih model pada data pelatihan
knn_model.fit(X_train, Y_train)
# Lakukan prediksi pada data uji
Y_pred_knn = knn_model.predict(X_test)
# Evaluasi performa model
accuracy_knn = accuracy_score(Y_test, Y_pred_knn)
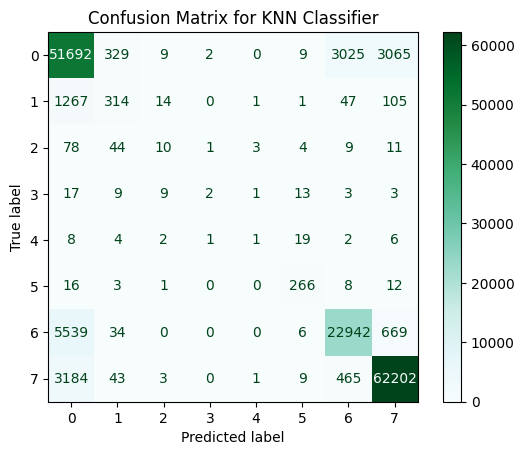
print("Accuracy KNN:", accuracy_knn)
Accuracy KNN: 0.8835434574362073
Membangun model dengan gaussian naive bayes#
from sklearn.naive_bayes import GaussianNB
# Inisialisasi model Naive Bayes
nb_model = GaussianNB()
# Latih model pada data pelatihan
nb_model.fit(X_train, Y_train)
# Lakukan prediksi pada data uji
Y_pred_nb = nb_model.predict(X_test)
# Evaluasi performa model
accuracy_nb = accuracy_score(Y_test, Y_pred_nb)
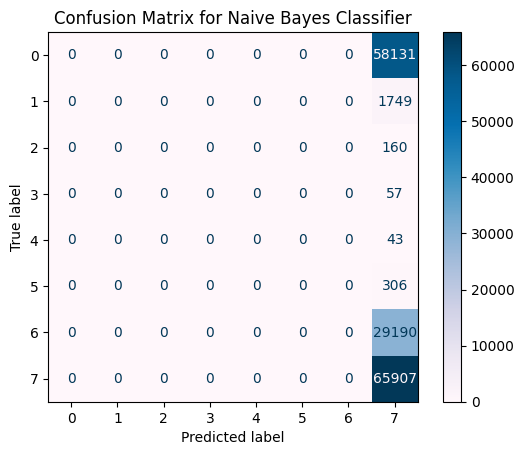
print("Accuracy Naive Bayes:", accuracy_nb)
Accuracy Naive Bayes: 0.42372205756607495
Membangn=un Model dengan Random Forest Classifier#
from sklearn.ensemble import RandomForestClassifier
from sklearn.metrics import accuracy_score

# Inisialisasi model Random Forest
rf_model = RandomForestClassifier(n_estimators=100, random_state=42)

# Latih model pada data pelatihan
rf_model.fit(X_train, Y_train)

# Lakukan prediksi pada data uji
Y_pred_rf = rf_model.predict(X_test)

# Evaluasi performa model
accuracy_rf = accuracy_score(Y_test, Y_pred_rf)
print("Accuracy Random Forest:", accuracy_rf)
Accuracy Random Forest: 0.8743562873289058
Evaluasi Matrix Setiap Model#
Confusion Matrix for MLP Classifier#
import matplotlib.pyplot as plt
from sklearn.metrics import confusion_matrix, ConfusionMatrixDisplay

# Menghitung confusion matrix
cm = confusion_matrix(Y_test, Y_pred)

# Menampilkan confusion matrix
disp = ConfusionMatrixDisplay(confusion_matrix=cm)
disp.plot(cmap=plt.cm.Blues)
plt.title("Confusion Matrix for MLP Classifier")
plt.show()
Confusion Matrix for KNN Classifier#
# Menghitung confusion matrix
cm_knn = confusion_matrix(Y_test, Y_pred_knn)

# Menampilkan confusion matrix
disp_knn = ConfusionMatrixDisplay(confusion_matrix=cm_knn)
disp_knn.plot(cmap=plt.cm.BuGn)
plt.title("Confusion Matrix for KNN Classifier")
plt.show()
Confusion Matrix for Naive Bayes Classifier#
# Menghitung confusion matrix
cm_nb = confusion_matrix(Y_test, Y_pred_nb)

# Menampilkan confusion matrix
disp_nb = ConfusionMatrixDisplay(confusion_matrix=cm_nb)
disp_nb.plot(cmap=plt.cm.PuBu)
plt.title("Confusion Matrix for Naive Bayes Classifier")
plt.show()
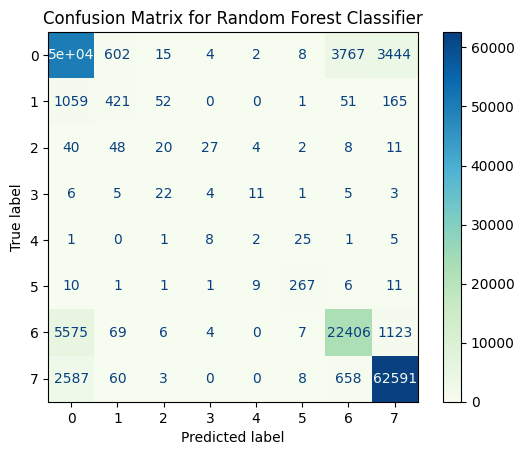
Confusion Matrix for Random Forest Classifier#
# Menghitung confusion matrix
cm_rf = confusion_matrix(Y_test, Y_pred_rf)

# Menampilkan confusion matrix
disp_rf = ConfusionMatrixDisplay(confusion_matrix=cm_rf)
disp_rf.plot(cmap=plt.cm.GnBu)
plt.title("Confusion Matrix for Random Forest Classifier")
plt.show()
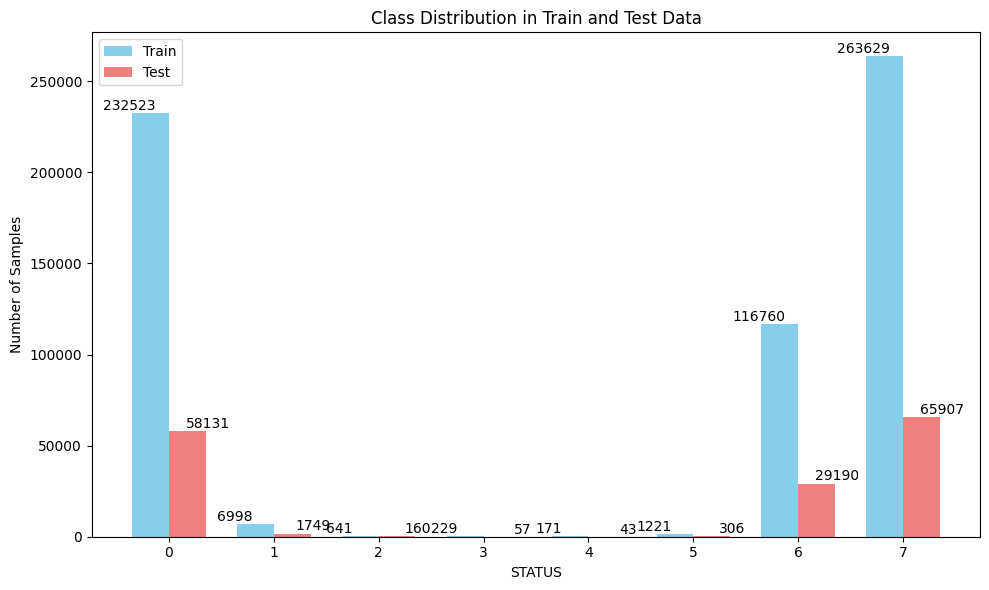
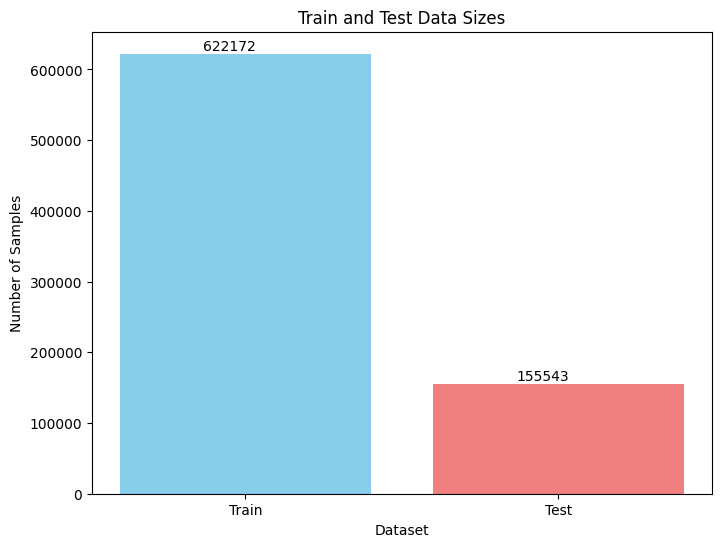
Melihat distribusi data test dan train#
langkah ini di lakukan untuk mencocokan jumlah data pada cinfusion matrix
train_size = len(X_train)
test_size = len(X_test)


plt.figure(figsize=(8, 6))
bars = plt.bar(["Train", "Test"], [train_size, test_size], color=['skyblue', 'lightcoral'])


for bar in bars:
    plt.text(bar.get_x() + bar.get_width()/2 - 0.05, bar.get_height() + 100, '%d' % int(bar.get_height()), ha='center', va='bottom', color='black')


plt.title('Train and Test Data Sizes')
plt.ylabel('Number of Samples')
plt.xlabel('Dataset')


plt.show()
import numpy as np

train_size = len(X_train)
test_size = len(X_test)

unique_classes = np.unique(np.concatenate((Y_train, Y_test), axis=None))


train_class_counts = [np.sum(Y_train == cls) for cls in unique_classes]
test_class_counts = [np.sum(Y_test == cls) for cls in unique_classes]


fig, ax = plt.subplots(figsize=(10, 6))
bar_width = 0.35
index = np.arange(len(unique_classes))

train_bars = ax.bar(index - bar_width/2, train_class_counts, bar_width, label='Train', color='skyblue')
test_bars = ax.bar(index + bar_width/2, test_class_counts, bar_width, label='Test', color='lightcoral')


for bar in train_bars:
    plt.text(bar.get_x() + bar.get_width()/2 - 0.2, bar.get_height() + 20, '%d' % int(bar.get_height()), ha='center', va='bottom', color='black')

for bar in test_bars:
    plt.text(bar.get_x() + bar.get_width()/2 + 0.2, bar.get_height() + 20, '%d' % int(bar.get_height()), ha='center', va='bottom', color='black')


ax.set_title('Class Distribution in Train and Test Data')
ax.set_xlabel('STATUS')
ax.set_ylabel('Number of Samples')
ax.set_xticks(index)
ax.set_xticklabels(unique_classes)
ax.legend()


plt.tight_layout()
plt.show()